


Experienced technical analyst reveals an indicator that suggests markets should start rising again
Technical analysis is probably not for everyone, which I understand. However, it is a method that can help us analyze not only stocks, but the entire market. One experienced analyst did a technical analysis of just the S&P 500 $^GSPCand-0.2%came up with an interesting finding. According to what, then, should the bear market end and the rallies begin again?
That experienced analyst is Josh Arnold of Seeking Alpha, who took on the Vanguard S&P 500 ETF, ticker VOO. This is meant to replicate the aforementioned S&P 500 index, which is considered the benchmark for the entire market. The index is already down 20% from the beginning of the year, so current readings are slowly starting to resemble the lows of July. Investors would certainly welcome an end to the declines. The analyst gave some reasons why yes and why no.
Important pointers
The prevailing trend is down. In the chart below, we can see the trend line, which shows that the market has perfectly hit the trend resistance from the all-time high set in January. Until this line is broken, we are still in a bear market.
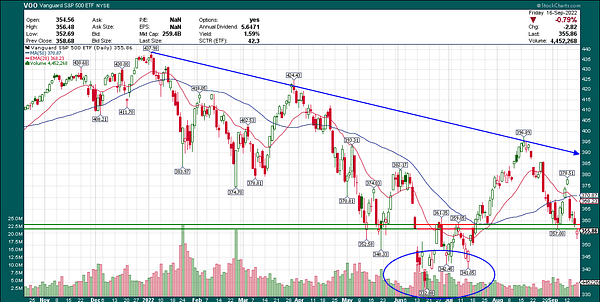
The next thing is support at roughly $358 and the bottom that was set in June. Support has been broken several times since the beginning of this week. The low from July is $334, but the market would have to fall about 6% more to get there.
As the analyst writes, the max pain after the sell-off earlier in the week was much higher on the indices than the current price. This normally means we are seeing some sort of return to growth, a rally. But more selling followed. What does max pain actually mean? For more experienced investors or traders, here is an explanation. The max pain strike price is simply the price at which the largest number of options expire. If max pain is higher than the current market price, it should rise. If max pain is lower than the current market price, there should be a decline.
Now let's look at a series of 5 charts.
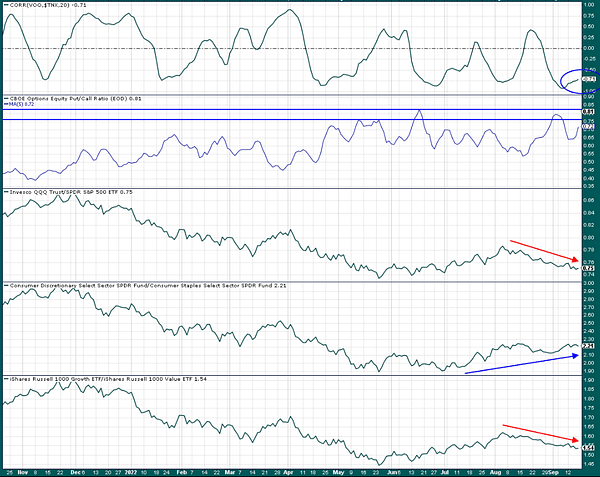
In the first chart, we see the correlation of the VOO ETF with the 10-year US Treasury yield. Rising bond yields are viewed negatively by the markets, while falling yields are welcomed by the markets. Or rather, this has historically been the case. So the first chart tells us that rates and equities are highly negatively correlated. In other words, when yields rise, stocks (more or less) fall. As long as this relationship holds, the direction of rates is critical for stocks. And as we now know, the Fed raised rates by 0.75%, so now the overall US interest rate is at 3.25%.
In the second chart, we see the ratio of stock sales and purchases. This is denoted as CPCE. Out of habit, the more this ratio rises, it means that more puts are being bought versus calls, which is an indicator of bearish sentiment. So when the maximum value is reached and this indicator starts to fall steadily, we can assume that the bear market is over (bottom). At the June low, the CPCE was at 0.81. We are now hovering around the 0.72 level.
The last three charts are ratio indicators that also help investors determine sentiment by plotting key stock types against each other. In order, there are Nasdaq stocks versus the S&P 500, consumer discretionary stocks versus consumer staples, and growth stocks versus value stocks. All of these charts show the relationship between the more aggressive areas of the market versus their more defensive counterparts. Discontinuities versus fundamentals are rising nicely (2nd chart), but the others are not. When you see these charts start to rise, especially if stocks keep falling, you will know that the bottom is near or has already occurred. We are not seeing that now, which lends credence to the idea that we will see a retest of the June low or somewhere near it.
The takeaway.
The analyst thinks we will touch the June lows, or at least get close to them. That would mean another 6% to 8% decline. He also thinks that will happen very soon and then the bear market will end, so it won't be long-lived.
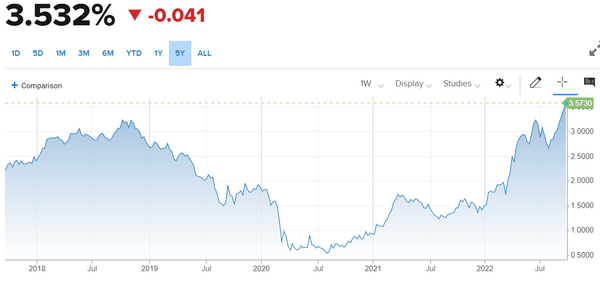
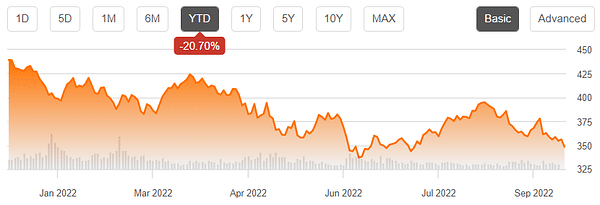
Since only the technical analysis aspects were taken into account here, I think this prediction is still positive. Personally, I wouldn't be surprised to see declines of easily over 10%. The aforementioned tightening of monetary policy by not only the Fed but a number of other central banks would also speak in favor. Moreover, as we can see in the chart above from CNBC, the yield on the 10-year US Treasury bond tested 3.6% at the time of writing. Looking at the chart over the last 5 years, we would be hard pressed to find a higher value. As a reminder, at the June low, the yield was 3.48%. And as we know, rising bond yields are not (mostly) liked by stocks.
How do you see it? Is the bear market coming to an end, or will we stumble in the doldrums for a few more months? 🤔