
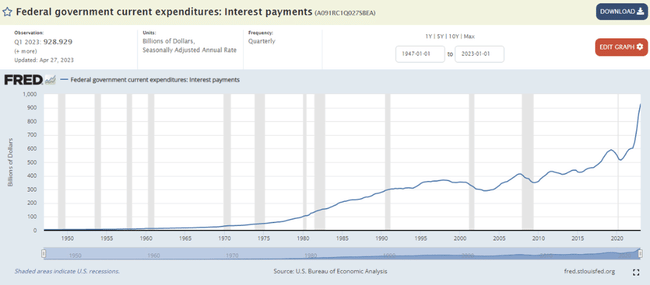
According to the latest statistics, the U.S. government paid $929 billion in interest on U.S. Treasuries in the 12 months ending in March this year, a new all-time record. A year ago, it was "only" $603 billion, meaning that interest on US government debt has increased by more than 50% in the last year!

Given that the Fed has raised the base fed funds rate by 5 percentage points from 0.25% to 5.25% over the past year, there is still an ongoing upward repricing of interest rates on US government bonds. Thus, the critical one trillion dollar mark in interest is very likely to be reached in the coming quarters.
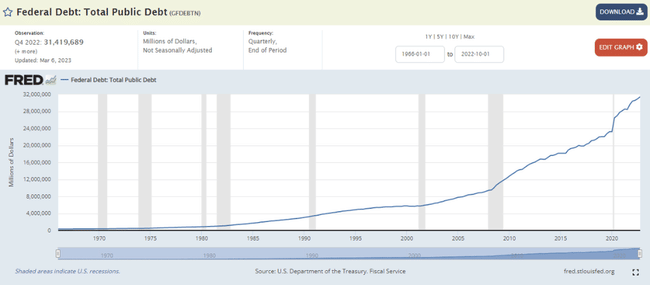
Meanwhile, US government debt in absolute terms has been rising steadily, as in most economies, and is currently at a record level of USD 31.4 trillion. Before the global financial crisis, it was not even USD 10 trillion.
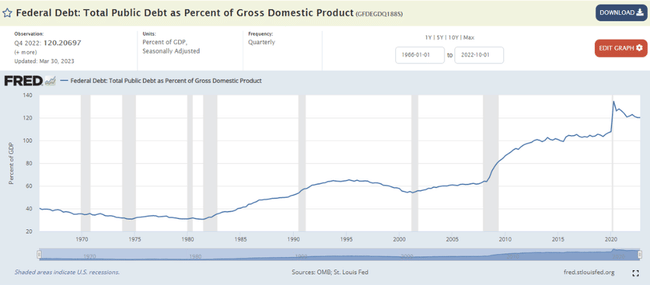
As a proportion of US GDP, the US government's debt is now 120%, which is pretty close to the pandemic peak of 135% in 2020. The US government budget deficit is also enormous, amounting to 5.4% of US GDP in 2022. This is obviously a huge figure, and the US economy was not even in recession last year! The US fiscal position is therefore truly dire at the moment, as it is in many eurozone countries or Japan, for example. All in all, the big question is how the US Treasury, under Janet Yellen, will cope with this debt load in the period ahead. I believe that the current absolute and relative level of US government debt is rather unsustainable in the long term, given the relatively high interest rates of the Fed, and all the more so as many of the world's major economies have in recent years stopped reinvesting their current account surpluses in US government bonds in particular and have rather started buying physical gold to a greater extent. China is a case in point. Therefore, the marginal demand for US government bonds is very likely to be much weaker now than it was 10 or 20 years ago, as can be seen in the fact that the share of dollar foreign exchange reserves in total global reserves has been falling steadily in recent years. This is one of the manifestations of 'dedollarisation'. The second current manifestation of dedollarisation is seen in international trade in international payments, primarily in emerging economies, which are gradually moving away from the dollar towards local regional currencies, particularly the Chinese yuan.
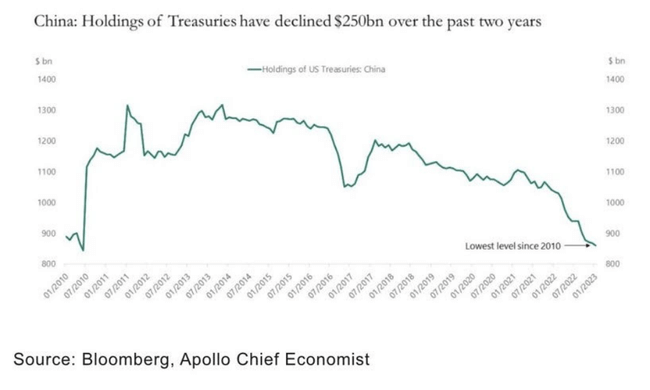
If we take a closer look at China in this regard, a very interesting chart on this topic has been published by Torsten Slok, chief economist at private equity group Apollo. On the chart we can see the evolution of the volume of US government bonds held by China since 2010. The peak was reached in 2013 at 1.3 trillion dollars. Since then, this volume has been steadily declining and now stands at "only" $850 billion, down by around a third from the historical peak. Moreover, this decline appears to have accelerated in the last two years or so.
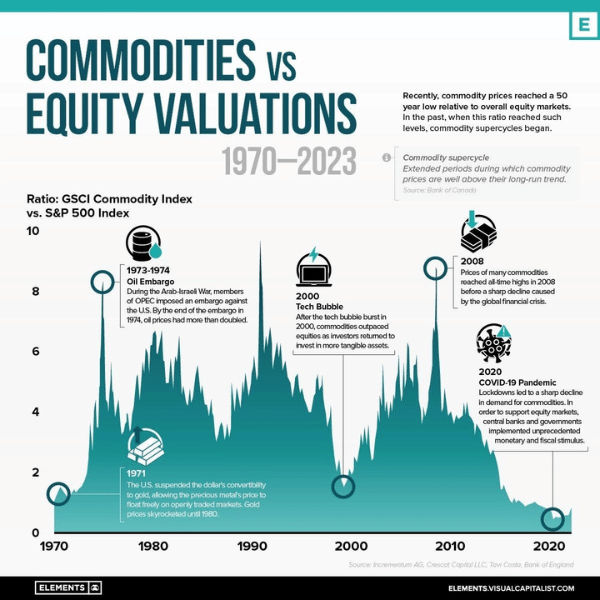
I was also interested in the following chart from the Austrian investment company Incrementum AG. This shows the ratio of the global commodity index GSCI to the main US stock index, the S&P 500, since 1970. On the chart we can clearly see that commodities are now very cheap on a relative basis to (US) equities, indeed, it could perhaps even be argued that commodities are now the cheapest ever on a relative basis. That said, the global commodity story has been very much to our liking for some time and we have exposure to this story in our funds of funds through the Franklin Gold and Precious Metals Fund from investment firm Franklin Templeton and the BGF World Mining Fund from investment firm BlackRock. Overall, we now believe that commodities should significantly outperform equities, and primarily U.S. equities, in the coming years.
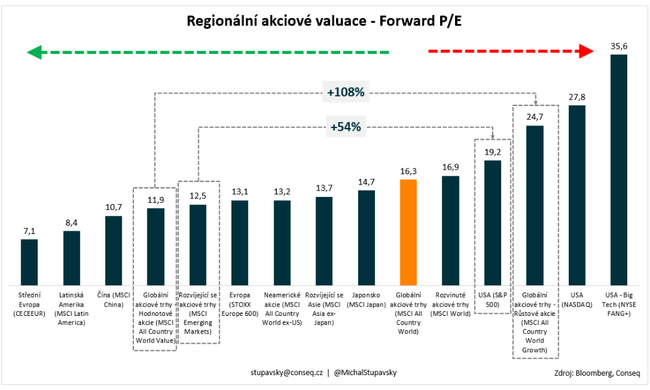
Our other two current global equity bets are 1) we strongly prefer emerging market equities over US equities and 2) we strongly prefer value equities over growth equities. Again, valuations are the key factor behind these bets. The MSCI Emerging Markets Equity Index now has a P/E of 12.5x and the S&P 500 US equity index has a P/E of 19.2x. This makes US equities on average 54% more expensive than emerging market equities, a valuation premium well above average in historical comparison. As for the second stock bet mentioned, the MSCI All Country World Value global index now has a P/E of 11.9x and the MSCI All Country World Growth global index has a P/E of 24.7x. Growth stocks are thus on average 108% more expensive than value stocks, which again is a valuation premium well above average in historical comparison. Overall, we believe these valuation discrepancies should narrow gradually over the coming period, which should help the relative outperformance of emerging markets and value stocks significantly.
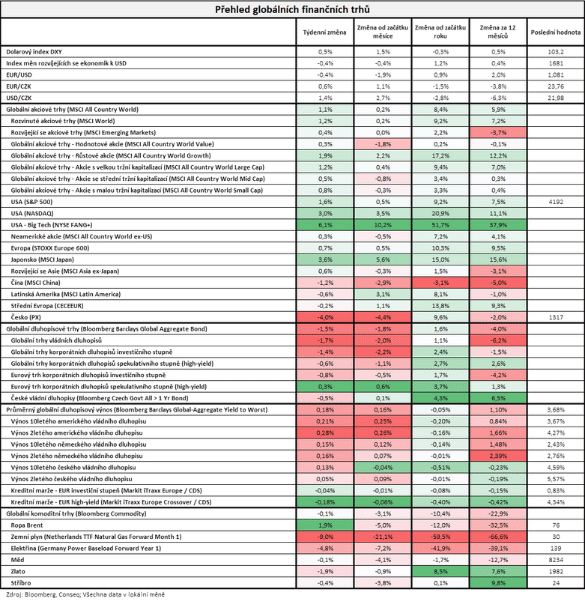
Turning to developments in financial markets over the past week, equity markets as measured by the broadest global index, MSCI All Country World, gained 1.1% and, conversely, bond markets as measured by the broadest global index, Bloomberg Barclays Global Aggregate Bond, shed 1.5%.
Please note that this is not financial advice.
I think a lot of retail investors get a lot of flack for holding only US stocks.
Personally, I have 10% gold in my portfolio and I sincerely hope I lose money on it because the US debt is going to be a big problem one day. At best it will end up with a lot of inflation and that will be very unpleasant, luckily stocks are mostly anti-inflationary.
The importance of geographical diversification is becoming more and more apparent.