
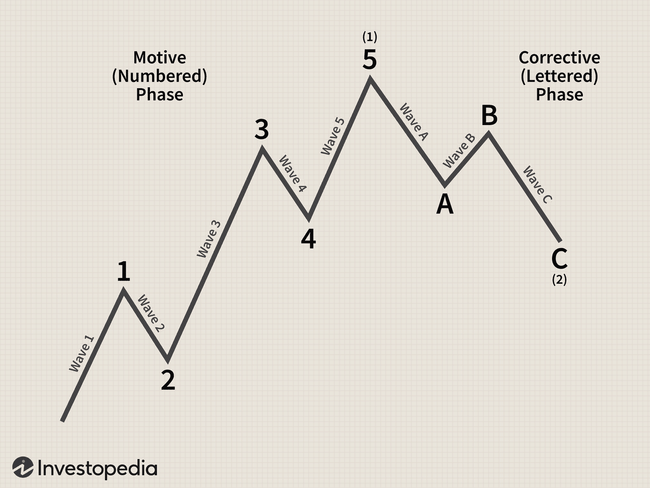
I would like to ask if anyone here is applying eliott wave theory in either short or long term projections.
Alternatively, what is your experience with it - is it worth using this tool?
I would like to ask if anyone here is applying eliott wave theory in either short or long term projections.
Alternatively, what is your experience with it - is it worth using this tool?
I mean, so I'll admit, again, something new to me in the investment world, I hope it gets the conversation going, because I don't know it. 😊 But from the chart I understand it's about price averaging most likely.