
Red Rock Resorts is an operator of luxury casinos and resorts in Las Vegas. The company focuses on the local mid-tier market, where it has built a strong position due to the quality of service and customer loyalty. And despite being one of the lesser known and smaller players in the sector, it can impress investors with better margins.
Red Rock Resorts is an American company operating casinos and entertainment facilities, mainly in Las Vegas, Nevada. It owns and operates 10 casino resorts, the most famous of which are Red Rock Casino Resort and Green Valley Ranch.
The company focuses on the local Las Vegas market and has a market share of around 15% in commercial casinos there and is the third largest player in Las Vegas after MGM Resorts and Caesars Entertainment.
Interestingly, Red Rock Resorts is the only publicly traded casino operator based in Las Vegas. The competitors (MGM, Caesars) are larger multinational companies. RRR is thus a pure-play player focused only on the Las Vegas market.
Red Rock Resorts is primarily known for the quality of its casinos and service to middle class customers. The resorts are more modern and luxurious than the average Las Vegas resort. The company places great emphasis on customer loyalty and provides generous bonuses in its loyalty programs.
In the future, the company plans to further expand and upgrade its resorts. It wants to strengthen its position in the market of premium casinos for tourists and the middle class. It also sees opportunities in sports betting, which has been legalized in Nevada. Key competitive advantages include brand, quality of service, customer loyalty and experience in the Las Vegas home market. On the other hand, the risk is the strong competition and the dependence on the performance of the Las Vegas economy, which has been growing at a weak pace recently.
Finance
The company's revenues are growing, and have increased 40% over the past 4 years. The largest growth has been in casino operating revenues (gaming and food), which account for about 75% of total revenues. RRR has been able to grow revenues primarily through acquisitions of smaller casinos and organic growth.
Looking at expenses, the largest expense item is operating expenses (30% of revenue), which have not been able to be significantly reduced in recent years, slightly squeezing margins. The casino business is cost intensive.
Profitability: operating margin has increased slightly to 36%, net margin is stable at about 12%. However, the company's profitability has been impacted by recent acquisitions and investments in capacity development, and profitability declined in 2020 due to the coronavirus crisis. Debt (3.9x debt/EBITDA) is quite high for me.
However, net income has fallen from 2021 to 2022, the reason being a change in the estimate of deferred tax liability which caused the company to pay higher income tax in 2021. Still, the company has performed decently relative to its competitors in recent years.
Balance Sheet
Red Rock Resorts' total assets are relatively stable. They are growing at a moderate rate of around 5% year-over-year. There is a decline in 2020 due to employee layoffs and closures due to covid. Since then, assets have been increasing again.
On the liabilities side, long-term liabilities, mainly bonds and loans, predominate. Total debt amounts to almost USD 3 billion and represents 90% of liabilities. This ratio is on the higher side but still manageable given the nature of the business. Part of the debt is covered by the long-term assets of the ministries, which is significant.
On the other hand, equity is on a downward trend due to share buybacks. In 2020, equity fell by more than 50% to just USD 32 mn, but has since partially recovered to USD 50 mn. Thus, despite the decline, the company's capital structure remains relatively conservative.
The company has invested heavily in its resorts in recent years, which is reflected in a high proportion of fixed assets as well as high depreciation. Tangible assets account for almost 90% of assets.
Overall, despite high debt and declining equity, Red Rock Resorts' financial position remains stable. The high proportion of non-current assets and non-current liabilities indicates that most of the debt is backed by the value of the resorts.
Cash Flow
Red Rock Resorts generates stable operating cash flow of around USD 500-600 million per year, which covers interest costs, taxes and some capital expenditure. However, free cash flow is highly volatile due to major fluctuations in investments and financing.
Investment cash flow is mainly affected by high capital expenditure in the resorts, which is around USD 400-500 million per year. In 2019 and 2020, investments exceeded operating cash flow, but the situation reversed in 2021 due to the issuance of new bonds.
In 2019-2020, the company issued around USD 1.8bn in bonds to repay existing debt and fund operational needs during the pandemic.
As a result, cash at the end of the period decreased significantly, but partially recovered to USD 117 mn in 2021. Despite the volatility, the company's liquidity remains at a solid level.
The US$142m share buyback of treasury shares in 2021 further reduced cash flow. This payment to shareholders, together with dividends, represents a significant cash outflow.
Overall, Red Rock Resorts' cash flow is primarily impacted by the high capital intensity of its business. While operating cash flow covers normal operating needs, free cash flow is significantly impacted by resort investments and capital operations. As long as the company can maintain solid operating results and moderate investments, free cash flow should grow gradually.
RRR stock is trading at a P/E of 16.24, slightly below the industry average. Forward P/E for the next year is 19.16. The stock is thus on the higher side of its historical range, but still attractively valued on this basis given the company's growth potential and resilience to the economic cycle.
The company pays a stable dividend of 2.14% with a healthy payout ratio of 28%. RRR maintains a relatively conservative capital structure with relatively low debt compared to peers.
Overall, I believe RRR is in the better part of the sector (and unlike its competitors, it pays a dividend) with potential for further growth. The company generates stable cash flow and is well positioned in the market.
Analysts' forecasts
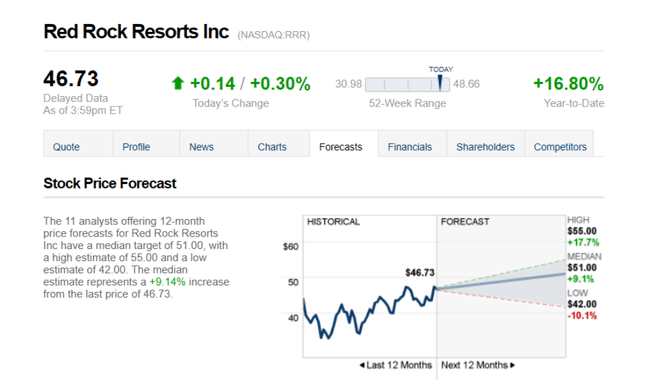
The 11 analysts offering 12-month price forecasts for Red Rock Resorts Inc have a median target of 51.00, with a high estimate of 55.00 and a low estimate of 42.00. The median estimate represents a +9.14% increase from the last price of 46.73.
- What do you think about the company? 🤔
Please note that this is not financial advice. Every investment must go through a thorough analysis.