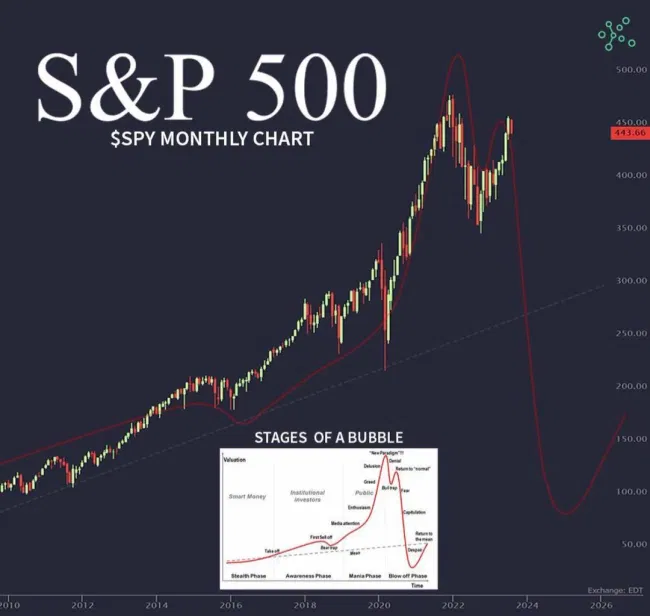
The picture is very interesting. If I were to make an estimate based on the current PE and its history and current inflation, I would see a drop of some 25%. But that decline will ultimately depend a lot on whether we experience deflation, stagflation or a soft landing in the future. So we don't really know anything at the moment. Personally, I'm moving into government bonds for a year.
According to that picture, that would mean a fall to somewhere around 2010 levels, maybe even earlier. There are two questions here. First, is the U.S. economy really worth the same as it was in 2010? And second, would investors really let it get there? In my view, the answer to both questions is no. After all, if it did, it would mean that the markets would erase 13 years of all the gains, which I think is unrealistic.
In fact, the markets would have been so attractively priced long ago that no one could resist, and I can't even imagine what would have to happen to bring those markets down that much. It would have to be armageddon in the world.
I've seen theories like that posted all the time about the crypt. :D I just don't know why there would be such a fall in the SP500 to 1000usd :D and that too so decisively through all the mega supports... I don't believe...

It looks interesting and perhaps we could see some correction. I would appreciate a correction as I could buy more :D
It won't be that black (red), but there is certainly room for a bit more correction than a few days.
I can see some correction, but not quite this dramatic a drop. The question is how long that correction can run. It's corrective.
The picture is very interesting. If I were to make an estimate based on the current PE and its history and current inflation, I would see a drop of some 25%. But that decline will ultimately depend a lot on whether we experience deflation, stagflation or a soft landing in the future. So we don't really know anything at the moment. Personally, I'm moving into government bonds for a year.
According to that picture, that would mean a fall to somewhere around 2010 levels, maybe even earlier. There are two questions here. First, is the U.S. economy really worth the same as it was in 2010? And second, would investors really let it get there? In my view, the answer to both questions is no. After all, if it did, it would mean that the markets would erase 13 years of all the gains, which I think is unrealistic.
In fact, the markets would have been so attractively priced long ago that no one could resist, and I can't even imagine what would have to happen to bring those markets down that much. It would have to be armageddon in the world.
I've seen theories like that posted all the time about the crypt. :D I just don't know why there would be such a fall in the SP500 to 1000usd :D and that too so decisively through all the mega supports... I don't believe...