


I would like to ask if anyone here is applying eliott wave theory in either short or long term projections.
Alternatively, what is your experience with it - is it worth using this tool?
I would like to ask if anyone here is applying eliott wave theory in either short or long term projections.
Alternatively, what is your experience with it - is it worth using this tool?
Una dintre comunitățile de investitori cu cea mai rapidă creștere din Europa
Date și informații cuprinzătoare despre mii de acțiuni din întreaga lume
Informații actuale din piețele globale și despre companiile individuale
Educație și schimb de experiență în investiții între investitori
Prețuri corecte, urmărire portofoliu, căutare acțiuni și alte instrumente
Toate datele furnizate pe Bulios sunt destinate exclusiv în scopuri informative și nu sunt destinate tranzacționării sau investițiilor. Află mai mult. Află mai mult
© Bulios 2024
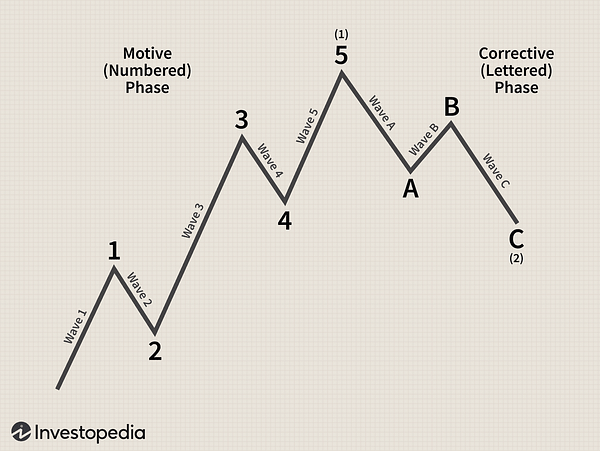
I mean, so I'll admit, again, something new to me in the investment world, I hope it gets the conversation going, because I don't know it. 😊 But from the chart I understand it's about price averaging most likely.
I'm sure you're not the only one, I haven't mastered the theory myself. It's technical analysis related to changes in investor sentiment and psychology (price goes in waves).
Oh, so it's a curve between market sentiment, market sentiment to market price? ...the points, the numbers is the price or the changes in investor behavioral sentiment?