


I would like to ask if anyone here is applying eliott wave theory in either short or long term projections.
Alternatively, what is your experience with it - is it worth using this tool?
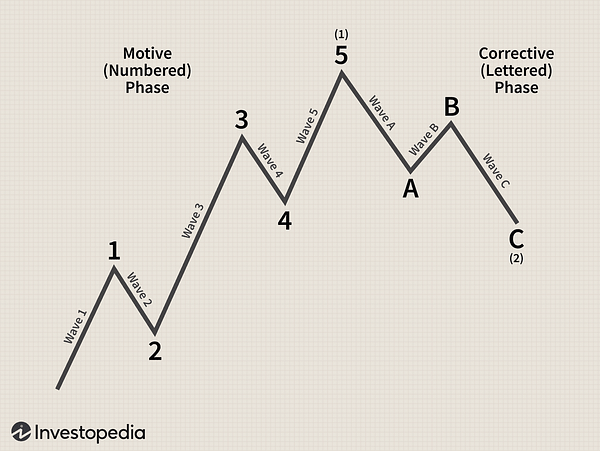
I would like to ask if anyone here is applying eliott wave theory in either short or long term projections.
Alternatively, what is your experience with it - is it worth using this tool?
Jedna z nejrychleji rostoucích komunit investorů v Evropě
Komplexní data a informace k tisícům akcií z celého světa
Aktuální informace z trhů i jednotlivých firem
Vzdělání a výměna zkušeností mezi investory
Férové ceny, portfolio tracker, stock screener a další nástroje
Veškerá data poskytovaná na portálu Bulios slouží pouze k informačním účelům a nejsou určena k obchodování nebo investování. Zjistit více
© Bulios 2024
I mean, so I'll admit, again, something new to me in the investment world, I hope it gets the conversation going, because I don't know it. 😊 But from the chart I understand it's about price averaging most likely.
I'm sure you're not the only one, I haven't mastered the theory myself. It's technical analysis related to changes in investor sentiment and psychology (price goes in waves).
Oh, so it's a curve between market sentiment, market sentiment to market price? ...the points, the numbers is the price or the changes in investor behavioral sentiment?