


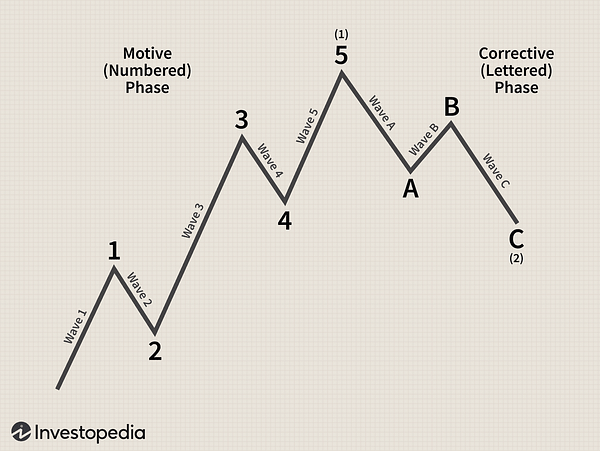
I would like to ask if anyone here is applying eliott wave theory in either short or long term projections.
Alternatively, what is your experience with it - is it worth using this tool?
I would like to ask if anyone here is applying eliott wave theory in either short or long term projections.
Alternatively, what is your experience with it - is it worth using this tool?
One of the fastest growing investor communities in Europe
Comprehensive data and information on thousands of stocks from around the world
Current information from global markets and individual companies
Education and exchange of investment experience among investors
Fair prices, portfolio tracker, stock screener and other tools
All data provided on Bulios is provided for informational purposes only, and is not intended for trading or investing purposes. Find out more
© Bulios 2024
I mean, so I'll admit, again, something new to me in the investment world, I hope it gets the conversation going, because I don't know it. 😊 But from the chart I understand it's about price averaging most likely.
I'm sure you're not the only one, I haven't mastered the theory myself. It's technical analysis related to changes in investor sentiment and psychology (price goes in waves).
Oh, so it's a curve between market sentiment, market sentiment to market price? ...the points, the numbers is the price or the changes in investor behavioral sentiment?