
Let's take a look at the situation in the economy today in terms of charts and statistics. Although we are not able to pinpoint whether or not a recession will occur here, on the other hand, a little bit of statistics and graphs can give us a clue. Is it worth being cautious at the moment? Let's take a look.

Recently, fears of a recession have reached a peak, with experts warning of a slowdown in the US economy. Although the labor market and consumer spending have remained resilient and a recession has not yet manifested itself, Bank of America has identified several signals that suggest the U.S. is heading for a recession.
March ISM and the new orders component
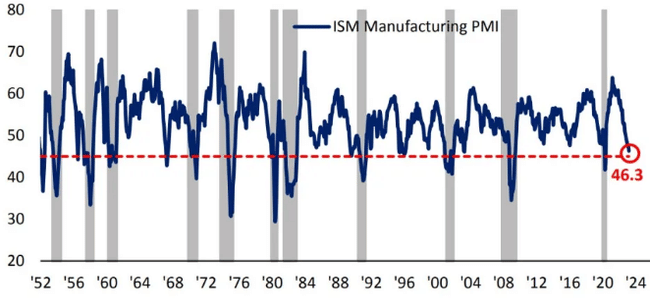
The March purchasing managers' index (ISM) came in at 46.3, the lowest level since May 2020. Historically, a drop in this index below 45 has signified a recession 11 out of 12 times in the last 70 years. So, as we can see, we are now only a short distance from this point where the economy has fallen into recession in most cases.
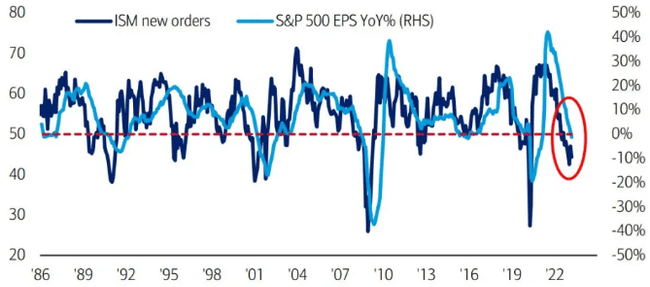
The new orders component of the manufacturing ISM fell to 44.3. When new orders were below 45, they were temporally correlated with recessionary EPS (earnings per share). How is this possible? If new orders are starting to decline, then corporate profits are starting to decline along with it. As profits decline, the growth of these companies is being held back, and so is the growth of the economy.
BofA Global EPS Growth Model
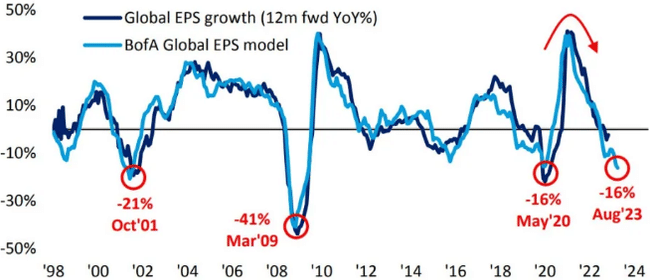
The BofA Global EPS Growth Model forecasts a 16% year-over-year decline in EPS through August. The model is influenced by Asian exports, global purchasing managers' indices (PMIs), financial conditions in China and the US yield curve. As we can see, Bank of America expects corporate earnings to decline. Looking back, there have been a total of 6 times in 25 years that earnings expectations have fallen, 3 of which have sent the markets down quite a bit.
The yield curve and recession expectations
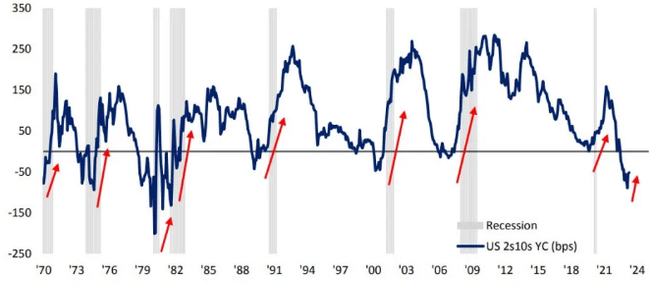
The yield curve of the 2 year/10 year US Treasury bond is flattening and inverting, another indicator of recession expectations. This flattening of the curve suggests that investors expect short-term rates to be lower than long-term rates in the near term.
If we look at the chart again, we can see that this phenomenon was mostly happening before the recession hit, or at least the stock market was taking a beating.
Tightening credit standards and the impact on small companies
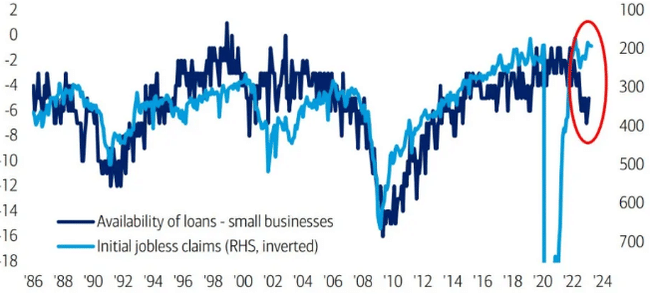
U.S. banks have tightened lending standards for small companies, which is related to small business demand for workers. This move may affect the ability of small companies to obtain financing and may have a negative impact on the overall economy. Smaller businesses are more susceptible to this and may experience layoffs as a lagging effect.
Investor sentiment on rates and recession
According to Bank of America, investors are too optimistic about rate cuts and not pessimistic enough about the recession. This attitude can lead to incorrect risk assessments and poor investment decisions. Recessions tend to be reliably negative for stocks and insufficiently discounted in advance, meaning investors often underestimate their impact on markets.
According to Bank of America, there is plenty of room for the S&P 500 to fall further. This forecast takes into account current economic indicators and the expected impact of the recession on the markets. Investors should prepare for a possible downturn and monitor the economy closely.
Conclusion
Although the labor market and consumer spending have remained resilient thus far, it is important to take seriously the warning signs that suggest an impending recession. Experts warn of a slowdown in the U.S. economy, which could have a negative impact on stocks and the overall market. Investors should be cautious, monitor key economic indicators and adjust their investment strategies to this potentially turbulent period.
WARNING: I am not a financial advisor, and this material does not serve as a financial or investment recommendation. The content of this material is purely informational.